Timeline Structure
The Timeline tab is organized into three categories:- Request
- Response
- Network Logs
1. Request Tab
The Request tab displays everything that was sent with your API request:- URL - The complete endpoint URL
- Query Parameters - Query strings and path variables
- Request Body - The data payload sent with the request
- Request Headers - All headers included in the request
- Authentication - Authentication details and credentials
- Variables - Variables used in the request
2. Response Tab
The Response tab shows all information received from the server:- Status Code - HTTP status code of the response
- Response Headers - All headers returned by the server
- Response Body - The complete response data
- Response Size - Size of the response payload
- Execution Time - Time taken to complete the request
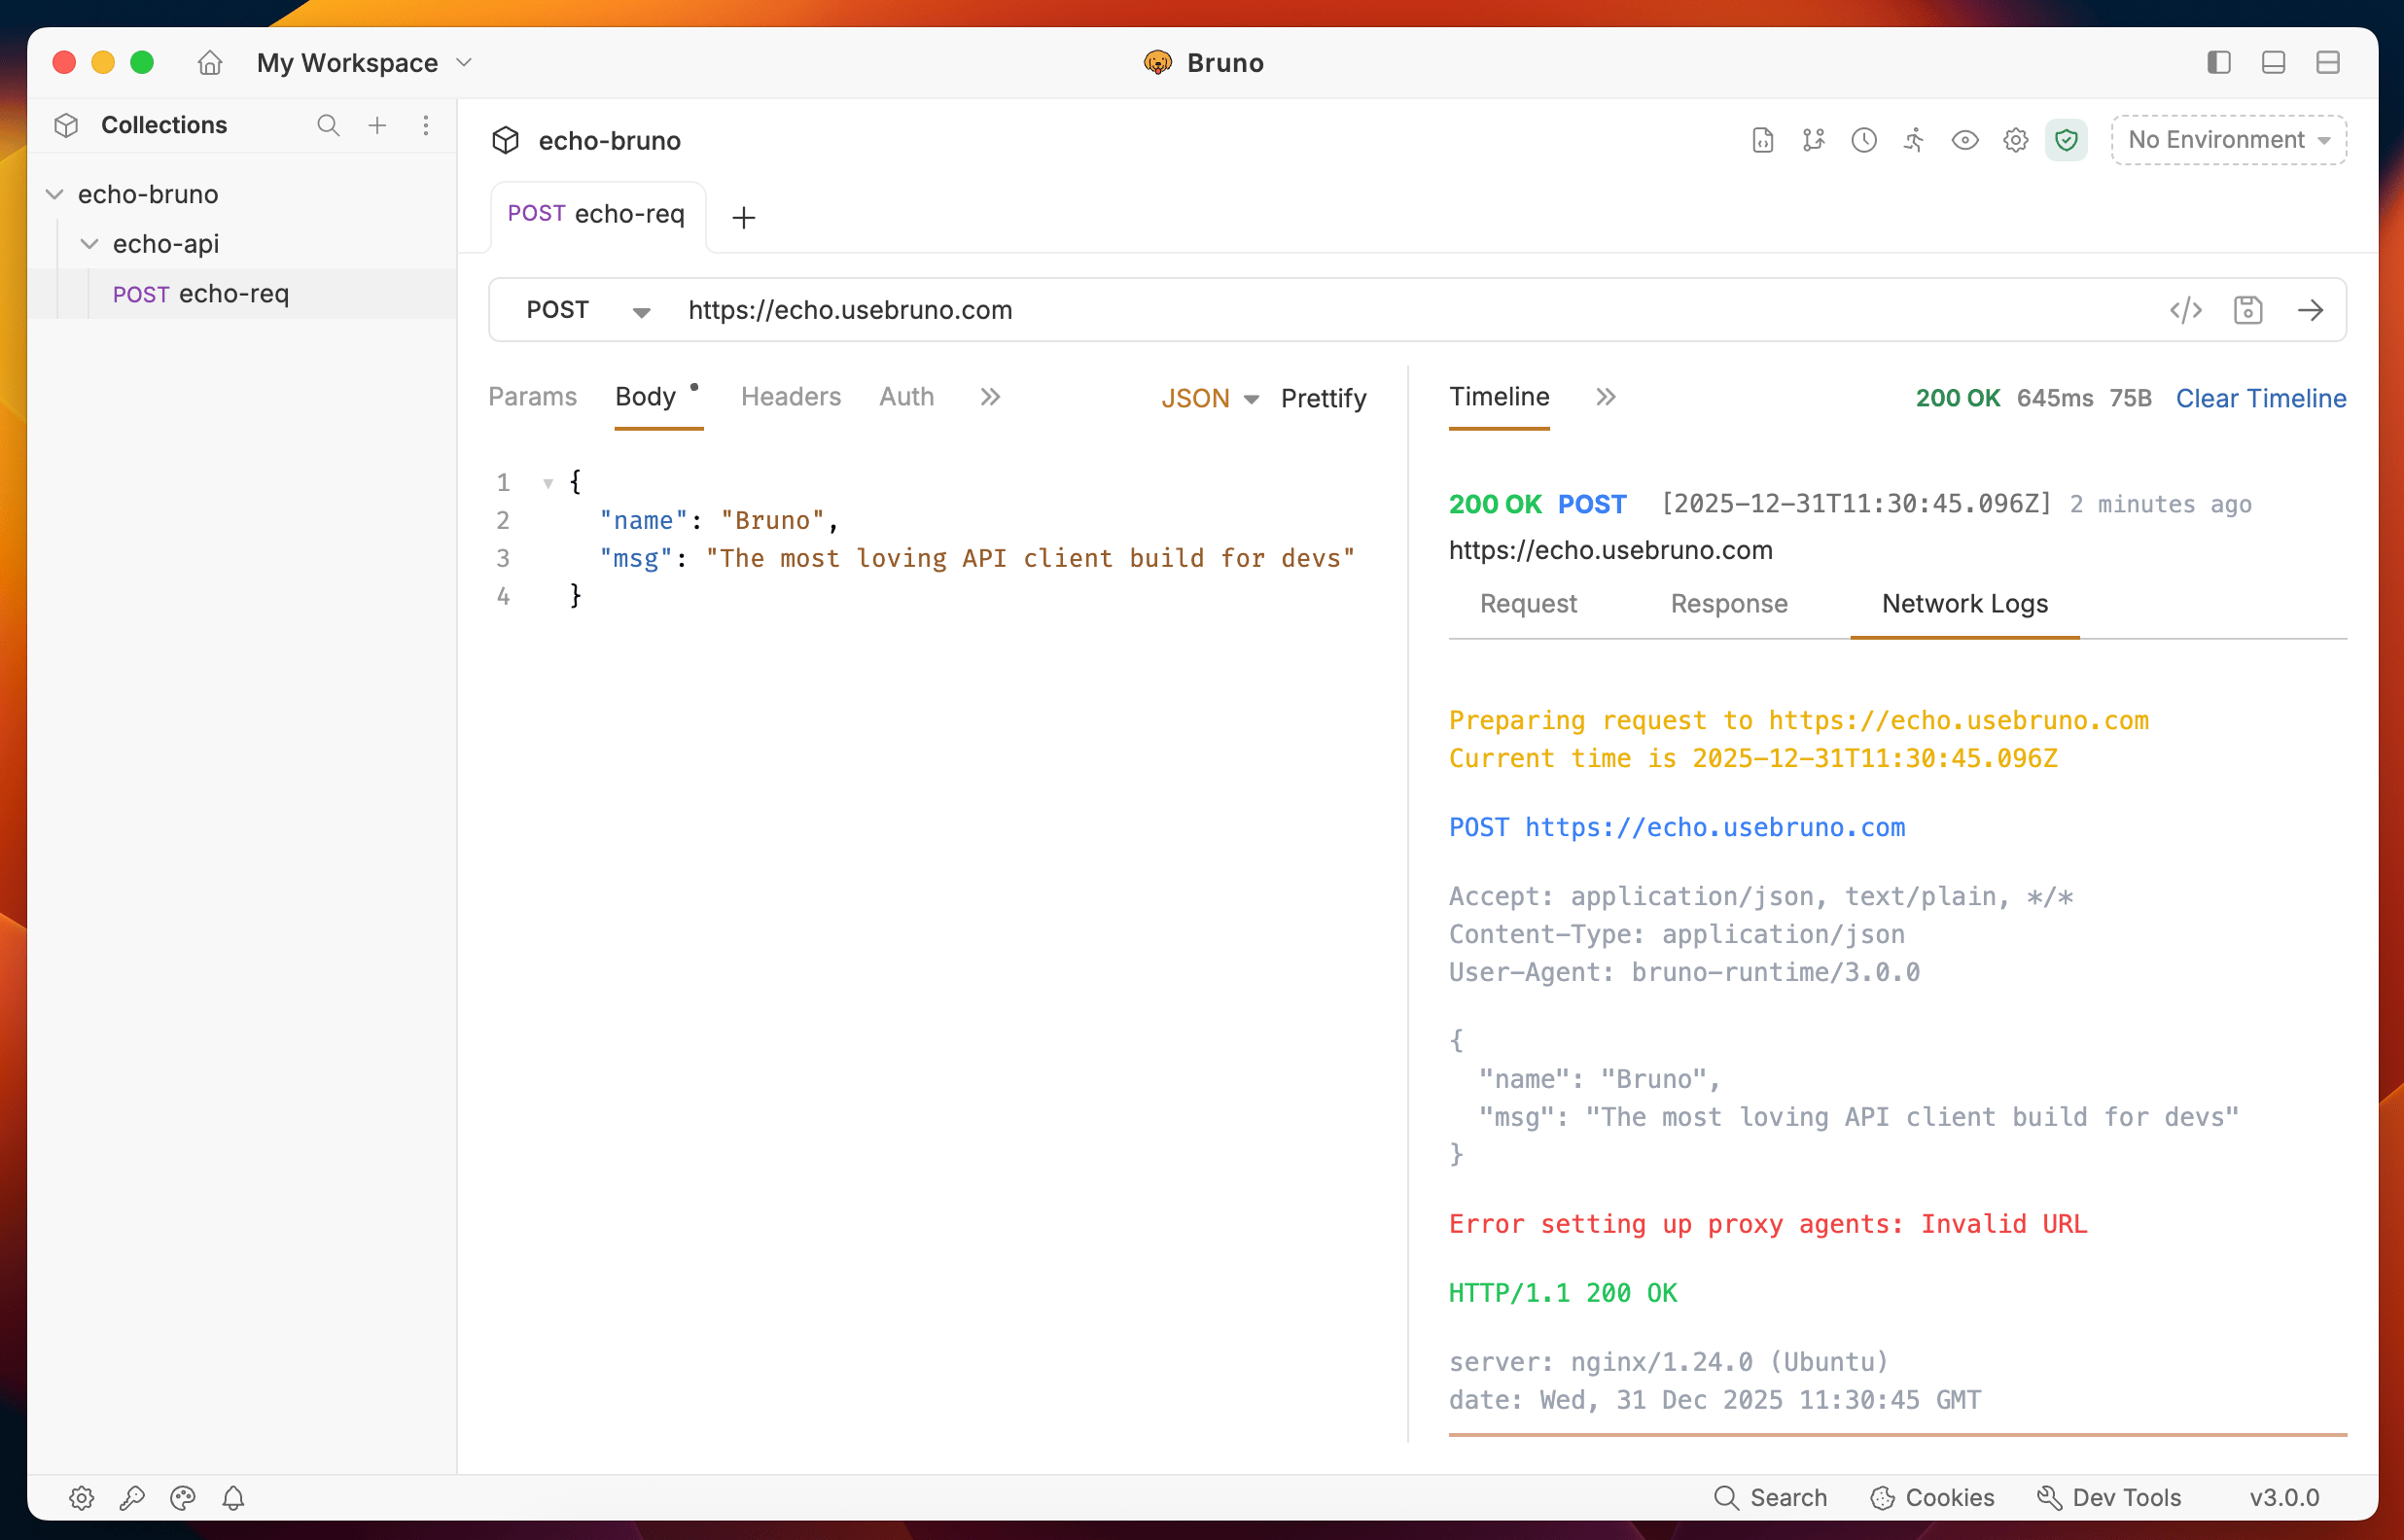
3. Network Logs Tab
The Network Logs tab provides low-level network insights for advanced debugging:- Request/Response Flow - Detailed timeline of the network transaction
- Network Timing - Breakdown of connection, DNS, SSL, and transfer times
- Protocol Details - HTTP version and connection information
- Debugging Information - Additional network-level diagnostics
Scripted requests
In addition to the main request you sent, the Timeline also shows HTTP requests made from within your scripts. Any call toaxios, bru.request, or another HTTP client inside a pre-request script, post-response script, or test is captured as its own entry alongside the main request.
Each scripted entry is labeled with the script phase it ran in (for example, pre-request, post-response, or tests) so you can trace exactly which script triggered each network call. OAuth2 token-fetch steps are also expanded inline under their parent request, making it easier to debug authentication flows.
You can filter timeline entries by type and expand any row to inspect its headers, body, and network log.
When you run a collection in the Runner, the Timeline shows scripted entries for each iteration alongside the main requests they belong to.